Performance in 2021

Focus on preserving infrastructure and maintaining financial strength throughout the pandemic enabled the successful ramp-up of Icelandair operations in 2021. Total operating income was USD 584.9 million, up by 35% between years. Net loss improved significantly between years and amounted to USD 104.8 million, as compared to net loss of USD 376.2 million in 2020. The Company turned a net profit of USD 20 million in Q3 2021.

Capacity in passenger network increased by 87%

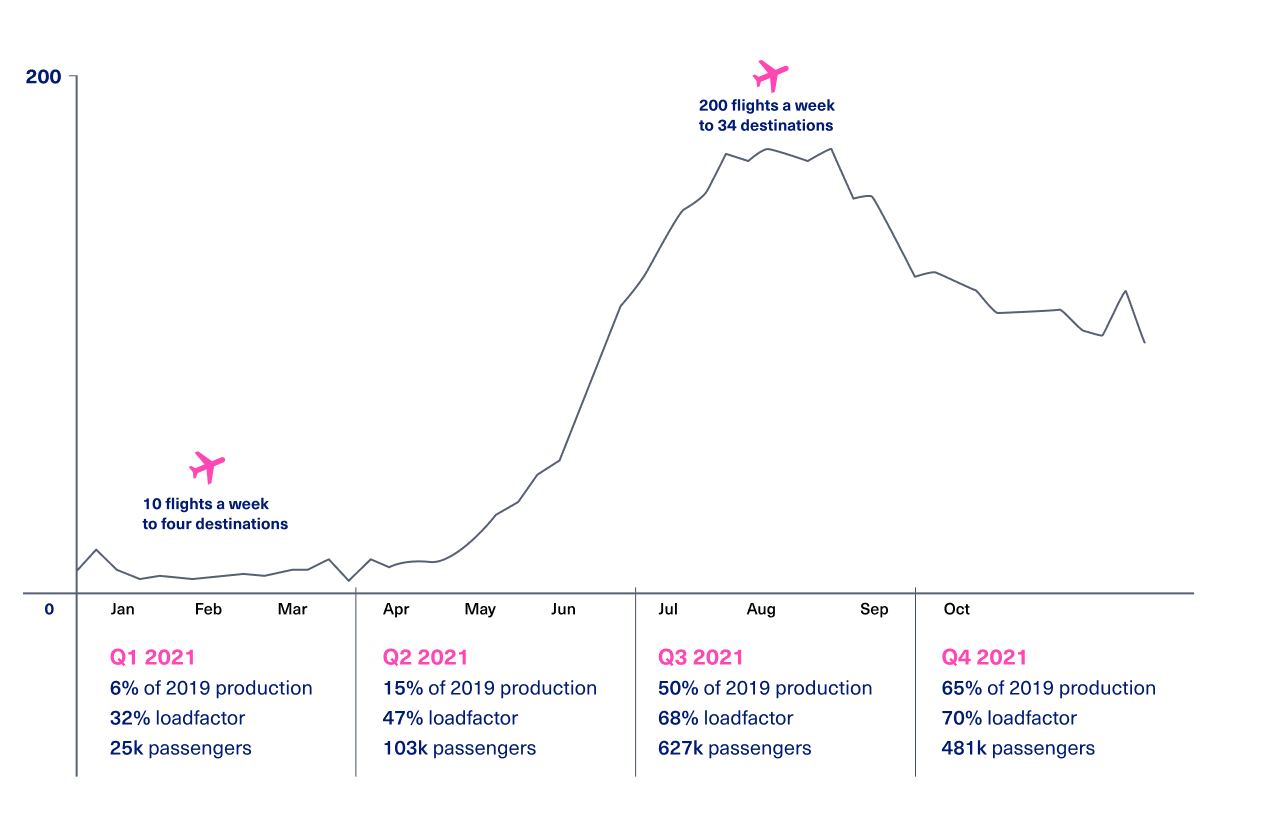
The year 2021 was a year of recovery where the total capacity in the passenger network increased by 87% compared to previous year. The ramp-up of the network started in June and the capacity was up to 50% of pre-covid capacity with 68% load factor in the third quarter. The capacity in the fourth quarter was up to 65% of pre-covid levels and the load factor reached 70%. There were some roadblocks on the way during the ramp up with the Delta variant in August and September and the Omicron negatively impacting load factor and results in December. The ramp-up was however very successful with almost 70% load factor in the second half of the year.

Number of trips in the international route network.png
2021 2020 % Chg.
Passenger flights total
Number of Passengers Thousand 1,461 891 64%
Load Factor (LF) % 65.3 67.2 -1.9 ppt
Available Seat KM (ASK) Million 5,963 3,191 87%
International flights
Number of Passengers Thousand 1,236 765 62%
Load Factor (LF) % 65.2 67.2 -2.0 ppt
Available Seat KM (ASK) Million 5,866 3,136 87%
On time performance Number 84.0 85.0 -1.0 ppt
Domestic flights
Number of Passengers Thousand 225 126 79%
Load Factor (LF) % 70.4 67.9 2.5 ppt
Available Seat KM (ASK) Million 97 55 78%
Charter and cargo flights
Sold Block Hours Number 13,492 14,180 -5%
Freight Tonne KM (FTK) Thousand 142,713 114,956 24%

Load factor

Passenger mix

1.5 million passengers – 85% in the second half of 2021

The total number of passengers on international and domestic flights was around 1.5 million in 2021 compared to 891 thousand in 2020, an increase of 64%. Icelandair divides its route network into four markets – to, from, via and within Iceland. The market “to” Iceland was the largest market and accounted for 47% of total passengers. As a leading airline in Iceland the recovery of Icelandair’s flight operation is vital for the Icelandic tourism industry and economy. The “via” market which was almost nonexistent majority of last year due to the travel restrictions between North America and Europe accounted for 23% of total passengers for the year. Passenger on the “from” market accounted for 14% of total passengers and domestic passengers “within” for 15%.

The cargo operation was strong in 2021

Carried freight measured in freight ton kilometers (FTK) increased by 24% compared to previous year and exceeded 2019 FTK’s by 7%. Demand was strong and carried freight increased between years in all markets with the largest increase, 51%, on the transit market.

The leasing operation continued to be significantly impacted by COVID-19 in 2021 and sold block hours on charter flights decreased between years by 5%.

Earnings

Turnaround in the second half of the year

After having focused on preserving our infrastructure, knowledge and maintaining financial strength throughout the pandemic, Icelandair was in a strong position for an efficient ramp-up as soon as passenger demand started to increase in 2021. The first half of the year progressed slowly; and then came the turnaround in the second half with improvements in terms of operating income and profitability. The Company turned a profit from regular operations in the third quarter for the first time in two years.

Net loss for the year amounted to USD 104.8 million compared to a loss of USD 376.2 million in 2020. EBIT was negative of USD 135.9 million compared to negative EBIT of USD 363.0 million in 2020. Cargo operations were strong with volumes and revenues exceeding pre-Covid levels, especially on the transit market. Although the leasing operation was challenging during the year, new opportunities were seized on this front that contributed to the Company´s revenue generation.
Earnings development 2021 2020 Change
Total revenue USDk 584,913 433,591 151,322
Total operating cost excl. depreciation USDk 607,716 520,085 87,631
EBIT USDk -135,939 -362,995 227,056
EBT USDk -130,059 -437,834 307,775
Net loss USDk -104,796 -376,176 271,380
EBIT ratio % -23.2 -83.7 60.5 ppt
Kaffiterían_1154 copy.jpg

Income

Passenger revenue up by 88%

Transport revenue totaled USD 453.9 million, up by 71% between years. Transport revenue counts for 78% of the Company’s total operating income. Of this figure, passenger revenues amounted to USD 333.8 million and increased by 88% compared to last year. Icelandair divides its route network into four markets – to, from, via and within Iceland. The increase in passenger revenue was greatest in the “to” market with Iceland as a destination, but passenger revenue also increased significantly in the three other markets with increased demand and capacity. Cargo revenue increased by 31% compared to 2020 and amounted to USD 87.4 million. Cargo volume increased by 24% between years, driven by increased demand in all markets especially in the transit market.

The capacity of the international route network increased by 87% with corresponding 62% increase in the number of passengers.

Revenue from tourism increasing significantly between years.

Revenue from aircraft and aircrew lease decreased from USD 64.7 million in 2020 to USD 42.7 million in 2021. Included in 2020 figures is revenue from an extensive cargo charter project from China to Europe and the US. Other revenue totaled USD 88.4 million in 2021down from USD 103.3 million from the preceding year. Included in other revenue 2020 is compensation from The Boeing Company due to loss incurred from the MAX suspension which account for the largest share. The decrease in sale in hotels and airports is primarily due to the divestment of Icelandair Hotels end of Q1 2020. Revenue from tourism increased significantly between years, amounted to USD 42.0 million compared to USD 18.1 million in 2020.

USD thousand 2021 2020 Change % Change
Transport revenue: 453,868 265,523 188,345 71%
Passenger and ancillary 366,482 199,040 167,442 84%
Cargo 87,386 66,483 20,903 31%
Aircraft and aircrew lease 42,676 64,739 -22,063 -34%
Other operation revenue 88,369 103,329 -14,960 -14%
Total 584,913 433,591 151,322 35%

Expenses

Operating expenses excluding depreciation amounted to USD 607.7 million and increased by USD 87.6 million from 2020. The main drivers are a larger flight schedule and higher fuel price. Icelandair went from serving only four destinations with 10 weekly departures from Iceland early in the year to 200 departures a week to 34 destinations during the summer peak. The capacity measured in available seat kilometers increased by 87% between years and Icelandair had reached 65% of the 2019 capacity at the end of the year.

USD thousand 2021 2020 Change % Change
Salaries and salary related expenses 215,485 207,892 7,593 4%
Aircraft fuel 119,886 76,450 43,436 57%
Aircraft lease 705 7,423 -6,718 -91%
Aircraft handling, landing and communication 65,079 40,399 24,680 61%
Aircraft maintenance expenses 49,783 47,179 2,604 6%
Other operating expenses 156,779 140,742 16,037 11%
Total 607,716 520,085 87,631 17%

Salaries and salary related expenses amounted to 215.5 million, increasing from USD 207.9 million. Repayments of notice period payments from the Icelandic Government, in accordance with Icelandic act no. 50/2020, due to those actions amounted to USD 28.3 million in 2020. The number of full-time employees at year-end was 2,393 in 2021 compared to 1,531 in 2020. Fuel expenses amounted to USD 119.9 million, up by USD 43.4 million, which represents a 57% year-on-year increase. The difference between years is explained by the ramp-up of the operation and 45% increase in fuel price. The average price in 2021 was USD 665/ton, as compared to USD 458/ton in 2020. Other operating expenses amounted to USD 272.3 million compared to USD 235.7 million in 2020. Main deviation between years is directly related to the ramp-up of operations especially in the second half of the year.

Net finance income USD 645 thousand

Net finance income totaled USD 0.6 million in 2021, as compared to net finance cost of USD 69.9 million in 2020. The finance income amounted to USD 13.2 million up from USD 2.7 million in 2020. Thereof net currency exchange gain amounted to USD 8.9 million. Finance cost totaled USD 20.8 million down by USD 8.8 million between years. Net currency exchange loss of USD 6.1 million was included in finance cost in 2020. Fair value changes were positive of USD 8.2 million in 2021 compared to negative changes of fair value in 2020 of USD 43.0 million.

Web image-Bojan_0270.jpg